Splunk Basics

Welcome to my blog! My name is Mohamed Abdalla Ibrahim and I am a Cyber Security Specialist and IS security enthusiast. With over 15 years of experience in an enterprise environment, I have a strong understanding of the business risks related to IT. I am always seeking out the newest technologies to upgrade my knowledge and enhance my skills and qualifications in my field. I am self-motivated and have strong communication skills, and my greatest goal is to be a distinguished source of innovation in the IT field. Thank you for visiting my blog, and I hope you find the information and resources on this site helpful and informative
Introduction
In this thread, I will explain Splunk Basics, Splunk is one of the leading SIEM solutions in the market that provides the ability to collect, analyze and correlate the network and machine logs in real-time, in this topic I will explain why Splunk provides better visibility of network activities and help in speeding up the detection.
Splunk has three main components, namely Forwarder, Indexer, and Search Head
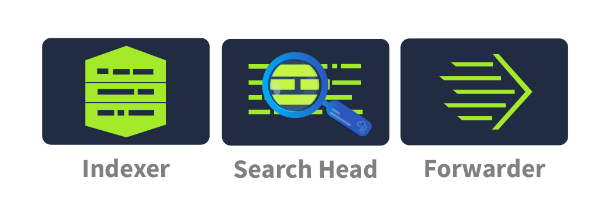
Splunk Components
Splunk Forwarder:
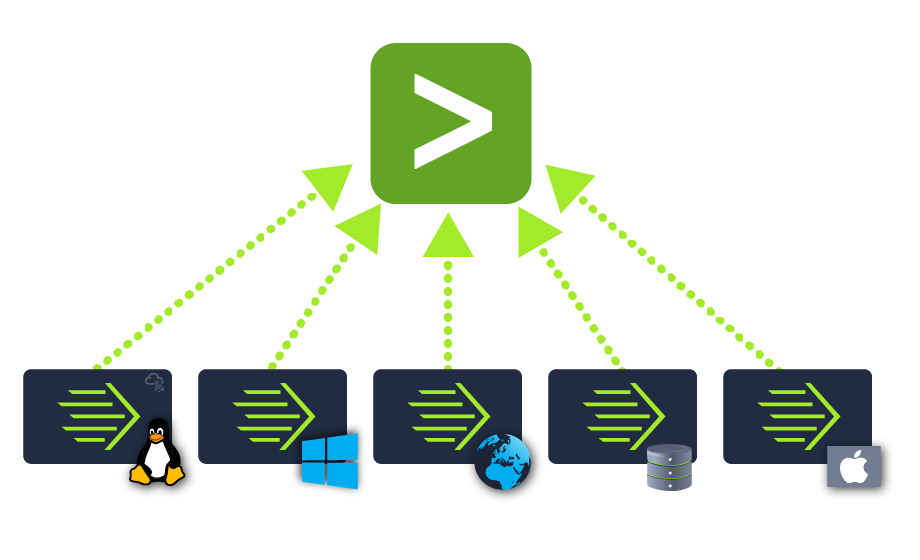
Splunk Forwarder is a lightweight agent installed on the endpoint intended to be monitored, and its main task is to collect the data and send it to the Splunk instance. It does not affect the endpoint's performance as it takes very few resources to process. Some of the key data sources are:
- Web server generating web traffic.
- Windows machine generating Windows Event Logs, PowerShell, and Sysmon data.
- Linux host generating host-centric logs.
- Database generating DB connection requests, responses, and errors.
Splunk Indexer
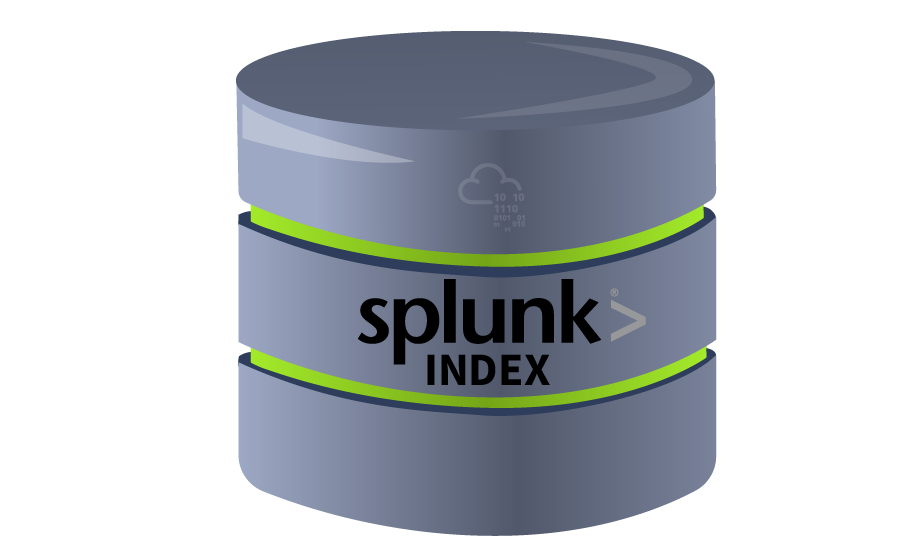
Splunk Indexer plays the main role in processing the data it receives from forwarders. It takes the data, normalizes it into field-value pairs, determines the data type of the data, and stores them as events. Processed data is easy to search and analyze.
Search Head
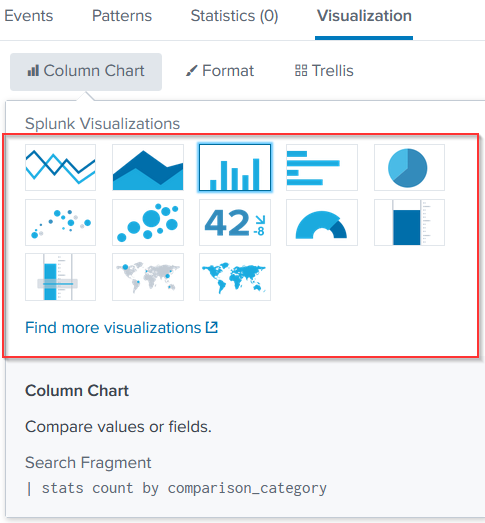
Splunk Search Head is the place within the Search & Reporting App where users can search the indexed logs as shown below. When the user searches for a term or uses a Search language known as Splunk Search Processing Language, the request is sent to the indexer and the relevant events are returned in the form of field-value pairs.
Navigating Splunk
Splunk Bar
When you access Splunk, you will see the default home screen identical to the screenshot below.
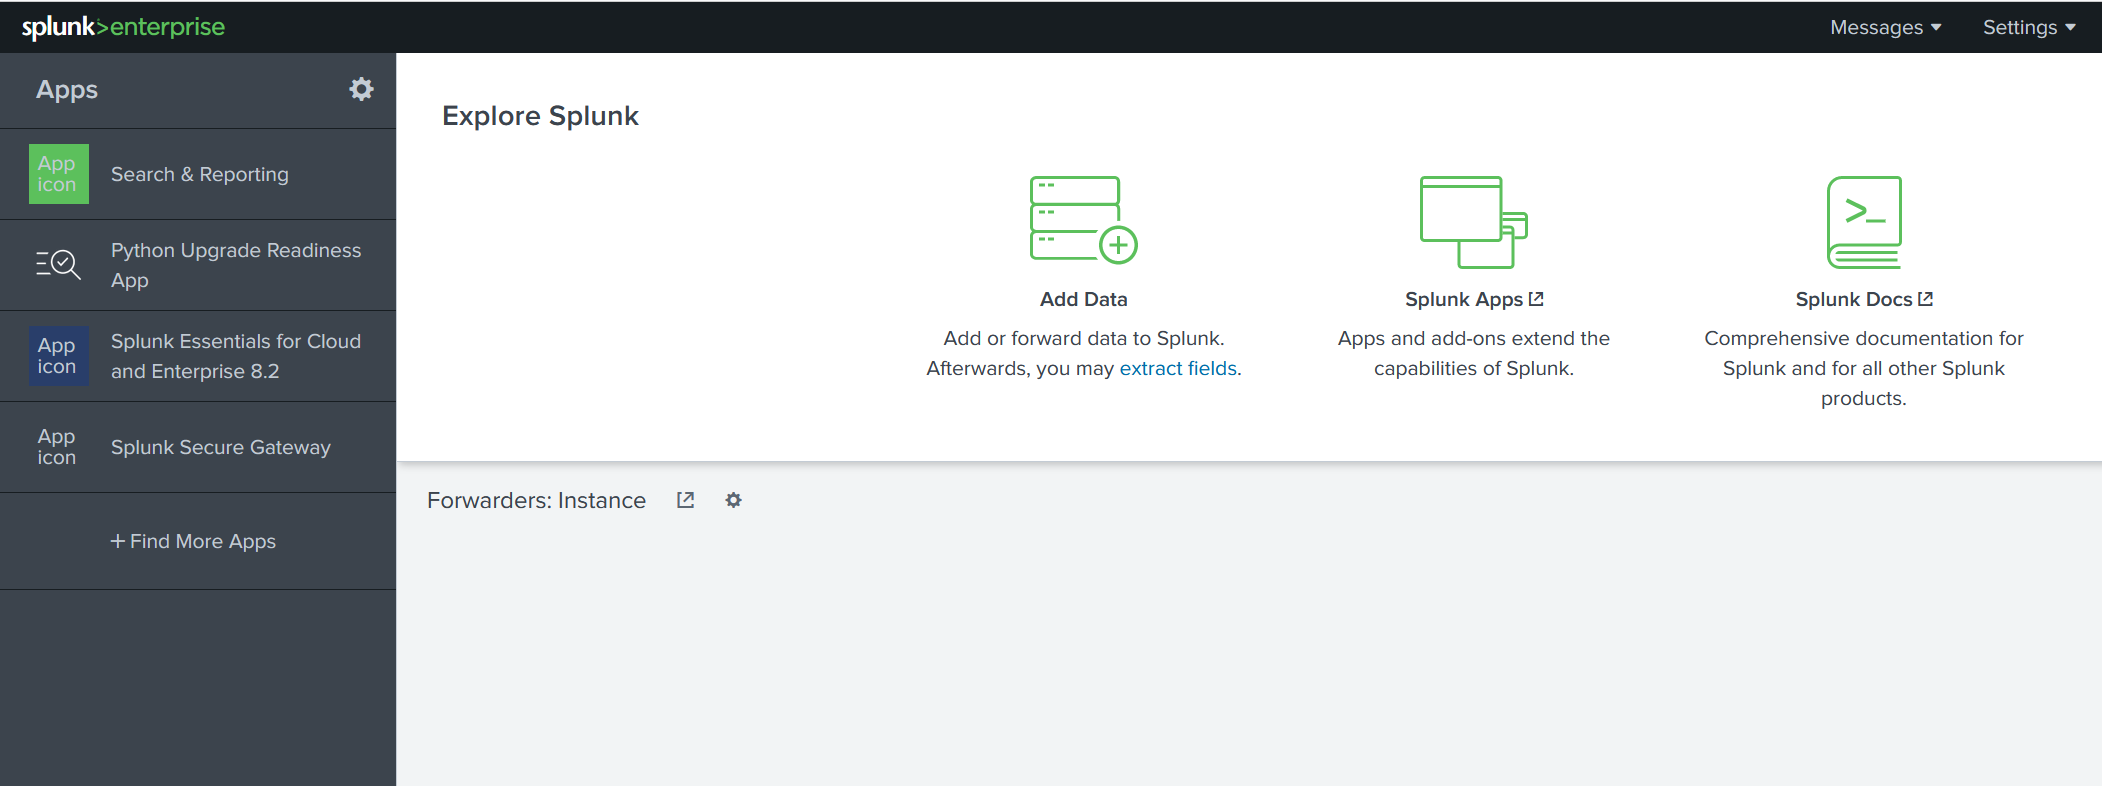
Let's look at each section, or panel, that makes up the home screen. The top panel is the Splunk Bar (below image).

In the Splunk Bar, you can see system-level messages (Messages), configure the Splunk instance (Settings), review the progress of jobs (Activity), miscellaneous information such as tutorials (Help), and a search feature (Find).
The ability to switch between installed Splunk apps instead of using the Apps panel can be achieved from the Splunk Bar, like in the image below.

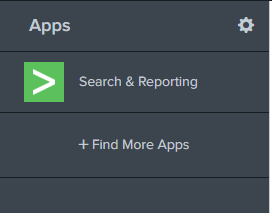
Next is the Apps Panel. In this panel, you can see the apps installed for the Splunk instance.
The default app for every Splunk installation is Search & Reporting.
Apps Panel
Explore Splunk
The next section is Explore Splunk. This panel contains quick links to add data to the Splunk instance, add new Splunk apps, and access the Splunk documentation.

Splunk Dashboard
The last section is the Home Dashboard. By default, no dashboards are displayed. You can choose from a range of dashboards readily available within your Splunk instance. You can select a dashboard from the dropdown menu or by visiting the dashboard listing page.
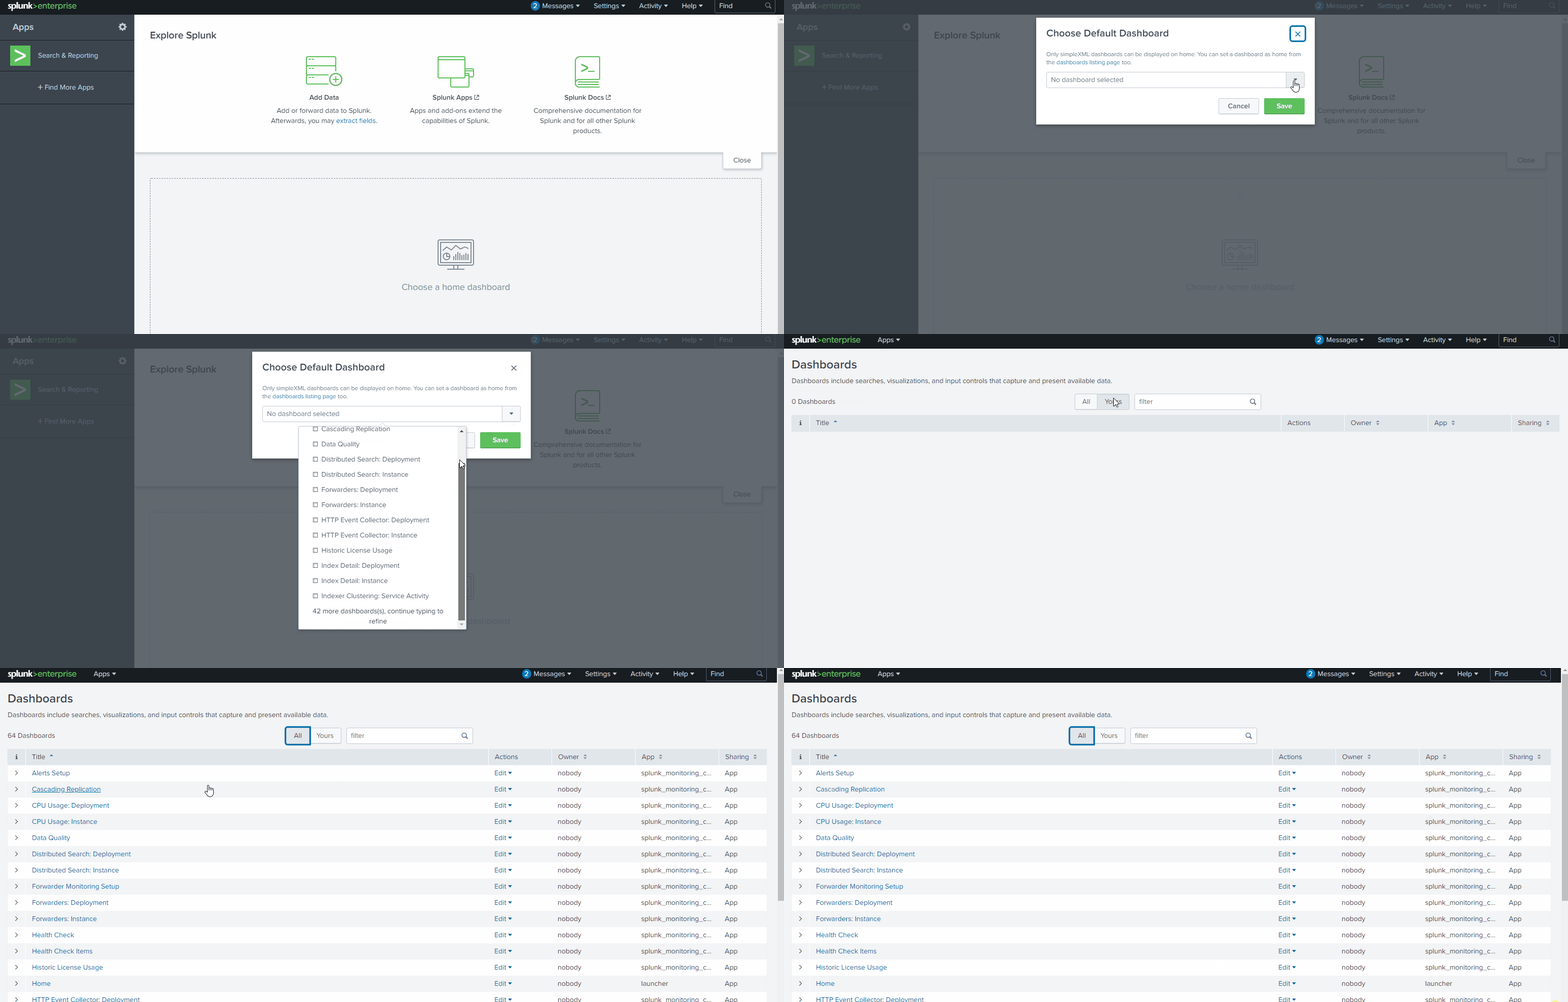
You can also create dashboards and add them to the Home Dashboard. The dashboards you create can be viewed isolated from the other dashboards by clicking on the Yours tab.
Adding Data
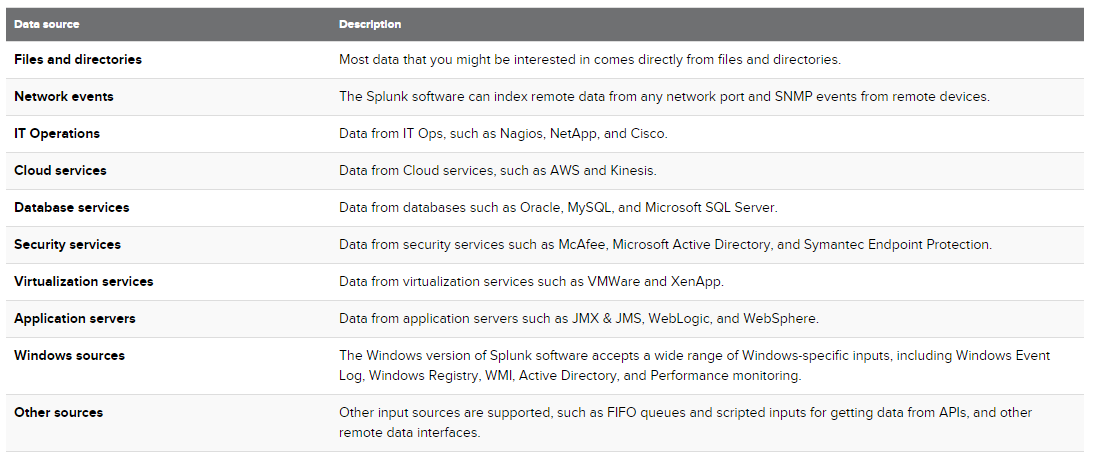
Splunk can ingest any data. As per the Splunk documentation, when data is added to Splunk, the data is processed and transformed into a series of individual events.
The data sources can be event logs, website logs, firewall logs, etc.
Data sources are grouped into categories. Below is a chart listing from the Splunk documentation detailing each data source category.
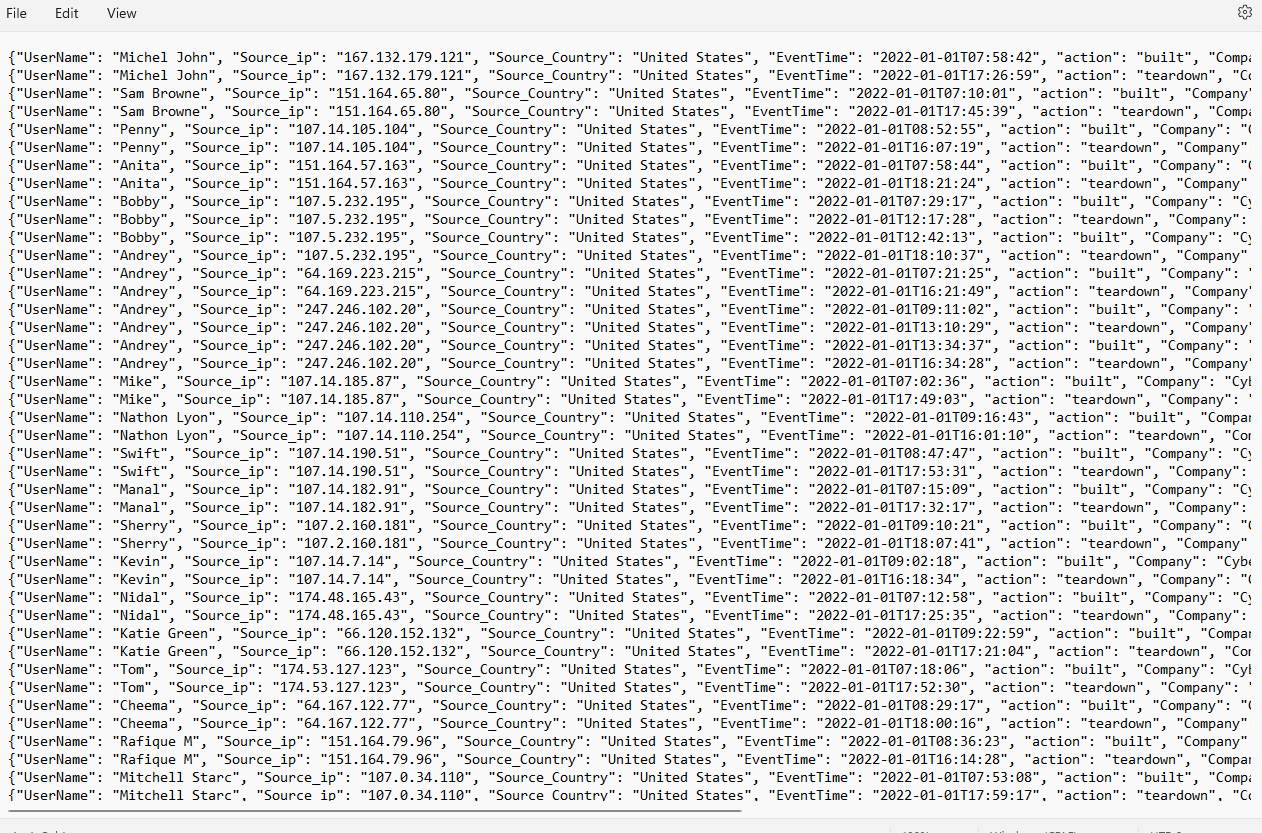
Ex: VPN logs. When we click on the Add Data link (from the Splunk home screen), we're presented with the following screen.
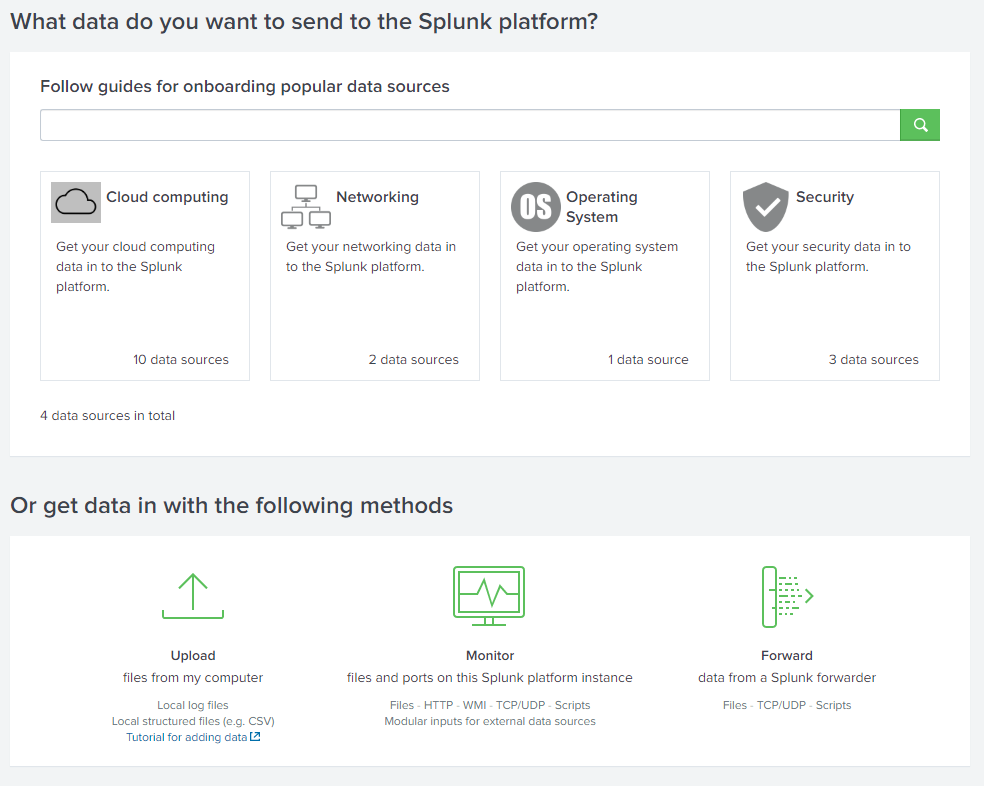
We will use the Upload Option to upload the data from our local machine. Download the attached log file and upload it on Splunk.
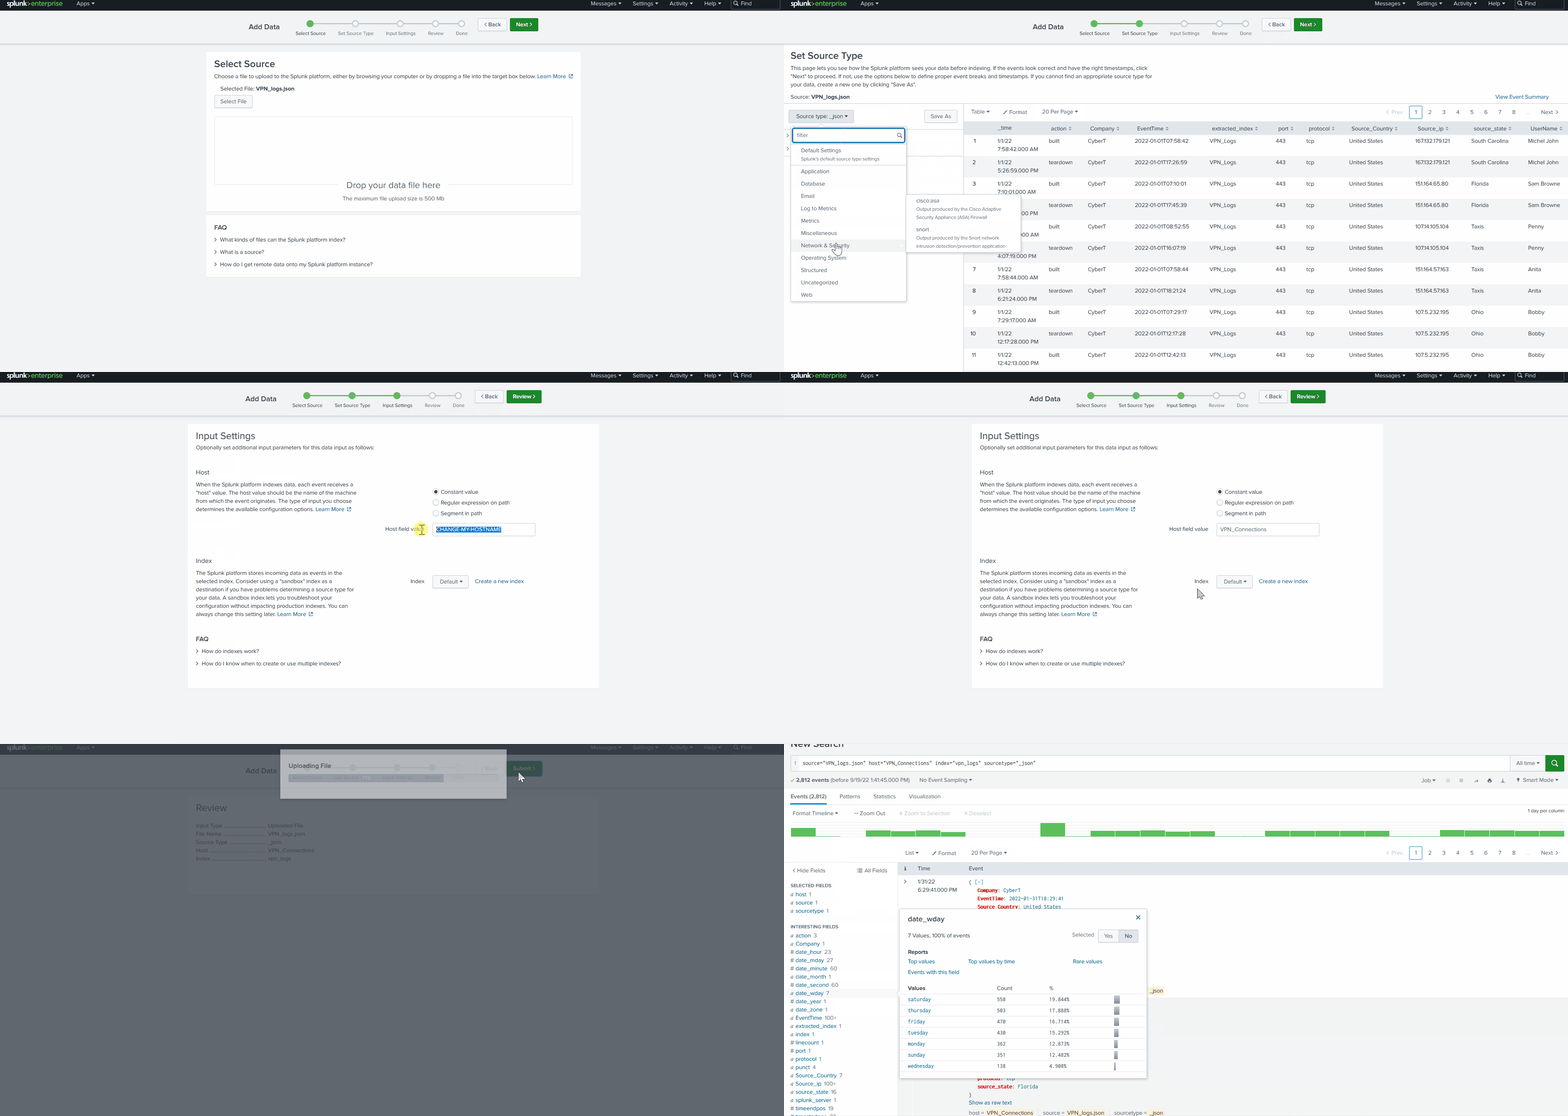
As shown above, it has a total of 5 steps to successfully upload the data.
- Select Source -> Where we select the Log source.
- Select Source Type -> Select what type of logs are being ingested.
- Input Settings ->Select the index where these logs will be dumped and the HostName to be associated with the logs.
- Review -> Review all the gif
- Done -> Final step, where the data is uploaded successfully and ready to be analyzed.
--> As you can see, there are A LOT more logs we can add to the Splunk instance, and Splunk supports various source types.
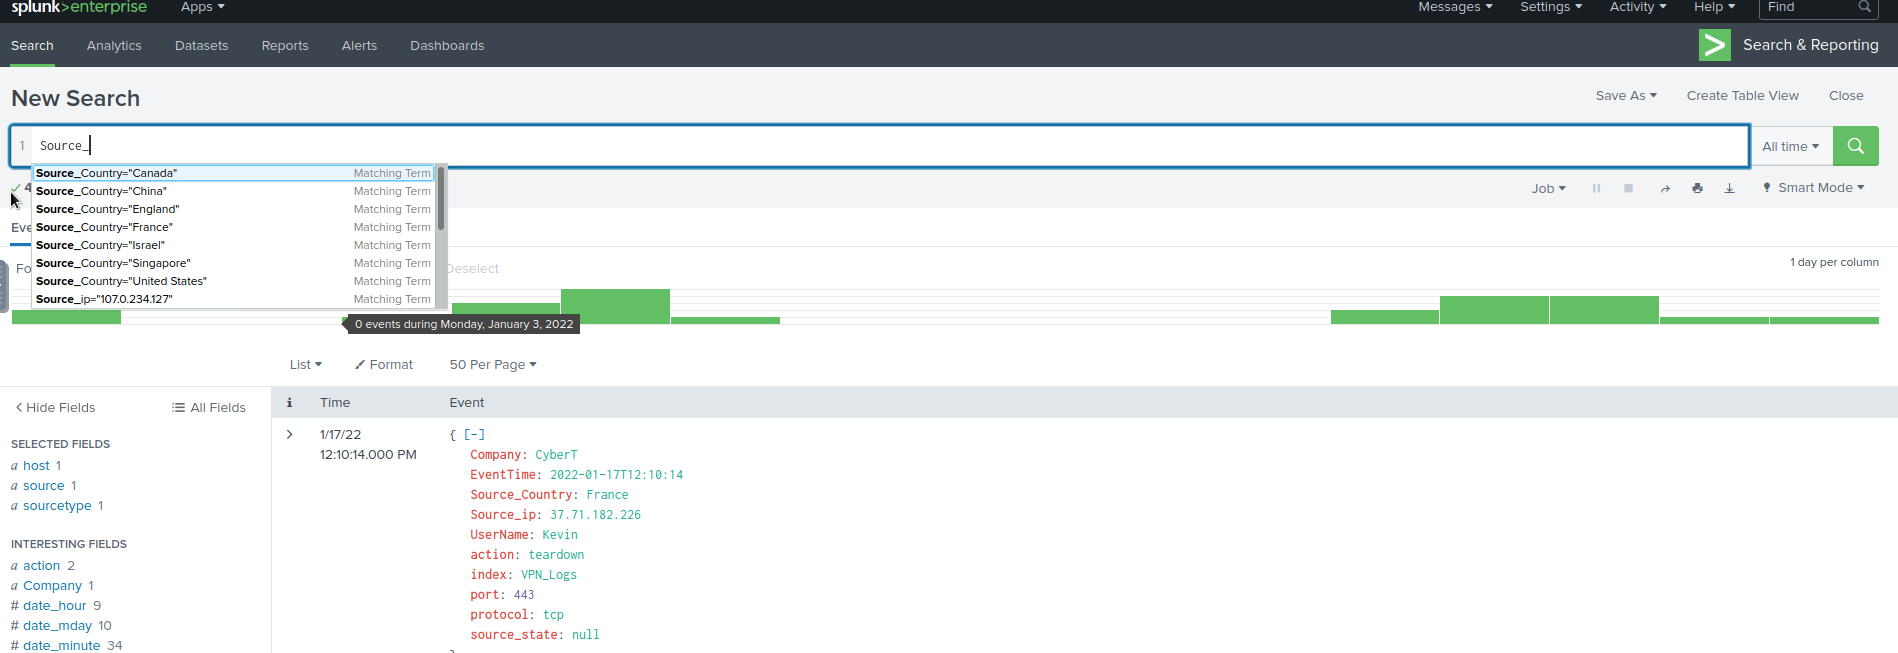
As you can see you can customize your search
Written by : Mohamed Abdalla Ibrahim
PMP | CISM | CISA | ITIL | CEH | Azure Cybersecurity Architect Expert | Azure Architect | IBM Cybersecurity Analyst


